Almost two months after opening its doors to the public, Google Plus has experienced both highs and lows. Amidst some controversy surrounding the success of its public launch, Google Plus has launched a slew of new features since then, some of which have been met with great fervor, others with mild distaste.
Almost two months after opening its doors to the public, Google Plus has experienced both highs and lows. Amidst some controversy surrounding the success of its public launch, Google Plus has launched a slew of new features since then, some of which have been met with great fervor, others with mild distaste. Google Plus now appears to have fallen into a more cyclical, predictable traffic pattern, but, not without leading with some impressive numbers first, which have overshadowed any comparable metrics put forth by its existing competitors.
In the social networks first 100 days, over 40 Million unique users have registered with the site, and over 3.4 Billion photos have been uploaded so far. Given the dip Chitika Insights saw in Google+ traffic following its public release, we were interested to see whether any of Google’s recent efforts to improve the site had an impact on user activity.
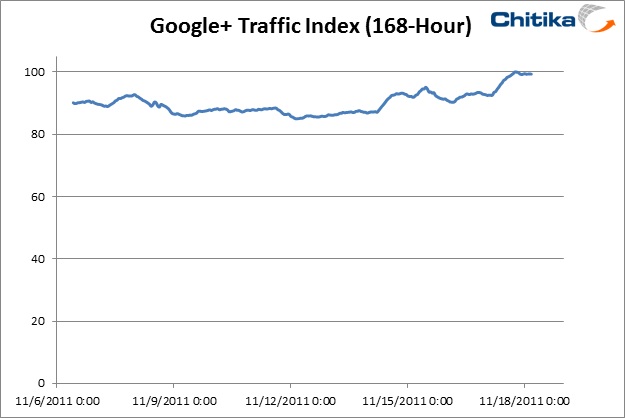
To identify the degree of Google Plus’s success Chitika Insights analyzed more than two weeks of data covering hundreds of millions of impressions, and boy were we pleased to see the results (a detailed explanation of our methodology is available here). As mentioned earlier, over the time period studied, activity on Google Plus appears to have fallen into a periodic cycle exhibiting signs of modest growth.

The first spike of interest occurs around November 1st with the rollout of Google Reader integration to Plus, and the release of the latest user interface for the Google Plus Android app, and the integration of Google Apps into the social networking site only a few days prior. On November 7th, a Google+ experienced a second spike in user activity which corresponded with the long awaited introduction of Pages for businesses – something both consumers and businesses have been anticipating since its public release. It is unclear as to what reasons the traffic spike on the 14th can be traced to, although it is likely due to excessive publicity (both good and bad) surrounding Google+ Pages, and the release of some minor features such as Google+ trending topics. Moreover, the story of the fledgling social network’s recent success becomes even more evident when analyzed using a 168 hour rolling average, visibly trending upward.

As of late, the traffic levels seen on Google Plus are the highest yet recorded on the Chitika Ad Network, data confirmed by Experian Hitwise. Given all of these spikes in user activity, the graphs above reveals an interesting trend; although the spikes in traffic are brief, there is a clear cause and effect – traffic following these peaks in traffic is significantly higher than it was previously. This indicates that many of the new features instituted by Google may have effectively driven user engagement by making the service more accessible and integrating further into its multi-product platform.